Prometheus 101 (slide) and Graphite


I created a simple presentation about Prometheus. I uploaded it using sporto/hugo-remark: A theme for using remark.js with hugo, and I found that creating it in markdown rather than PowerPoint allowed me to focus more on the content. (But that doesn’t necessarily mean the content is better.)
| “He who knows one, knows none” - Max Müller
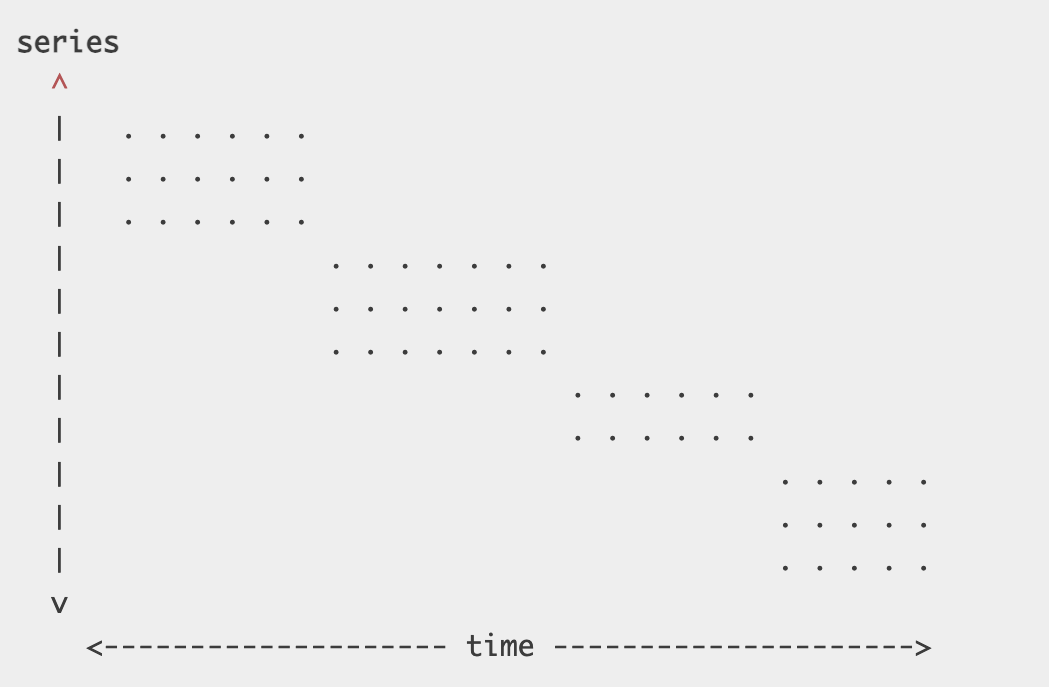
Prometheus is the monitoring system I encountered after Graphite. Graphite is a metric-based monitoring system written in Python. But due to its file-based TSDB characteristics, it’s difficult to solve Series Churn problems when they occur(One file per time series).
This problem got worse when cloud environments like AWS were set up, because servers became instances.

While Prometheus isn’t completely free from this problem, it has a fundamentally better structure because it handles data in blocks and chunks. (I believe I heard that Prometheus TSDB v1 had a structure similar to Graphite.)
Graphite performs metric aggregation during collection through carbon relay, but if some metrics that are targets for aggregation arrive late due to network instability, the aggregation results become distorted. (We often described these metric graphs as having “missing teeth”.)
In contrast, Prometheus uses a pull model, and its Recording Rules approach queries metrics collected in the TSDB for aggregation. This makes reliability easier to guarantee. While Graphite can discard raw metrics after aggregation, Prometheus must first store raw metrics in the TSDB to perform aggregation.
In my personal opinion, scraping targets has better manageability than receiving metrics from thousands of servers. (Of course, Service Discovery functionality is necessary for this.)